
The Rise and Stall of the U.S. Smart Speaker Market – New Report
Smart speakers powered by Alexa, Google Assistant, and Siri represented a white-hot consumer device market in the 2016-2019 period. Surging sales were accompanied by a deluge of popular culture appearances. However, high double-digit growth rates were replaced by low single digit growth the past two years. The pandemic didn’t help with smart speaker sales but the segment’s weakness was already evident in Voicebot’s national consumer survey in January 2020 before the world went into lockdown.
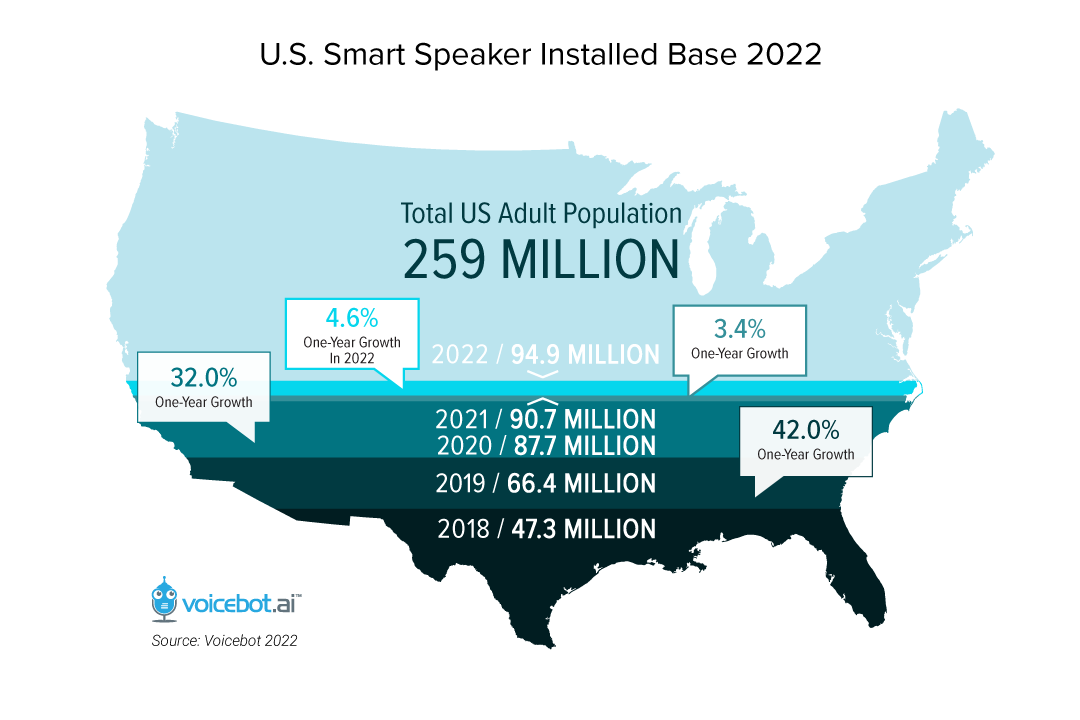
However, it is hard to say smart speakers are anything but an astounding success as a product category. There are now 95 million U.S. adults that have at least one and 50% of device owners use them daily. That is a formidable product category with intense user loyalty.
Rapid Growth
The industry ramped up from zero devices in late 2014 to over 47 million users as of January 2018. The subsequent two years delivered nominal user base growth of 19 million and 21 million. For the past two years, the figures were 3.0 million and 4.2 million respectively. That’s a sizeable nominal and relative decline. A post-2020 recession bounceback did not occur — at least not yet.
Pandemic-related behavior changes actually led to an uptick in usage among the majority of smart speaker owners. That rise in usage has had some staying power but much of it reverted back to the pre-pandemic levels as consumers were able to get out of their homes more easily in the U.S.
The Great Stall
This data and accompanying analysis can be found in the Voicebot’s fifth annual U.S. Smart Speaker Consumer Adoption Report 2022. Historically, the U.S. market, as the first to have smart speakers, provided insight into how adoption in other countries was likely to play out 18 months to three years later. That difference may be compressing as U.S. adoption slows and other markets continue their more deliberate adoption patterns as we saw from UK and Germany figures in 2021.
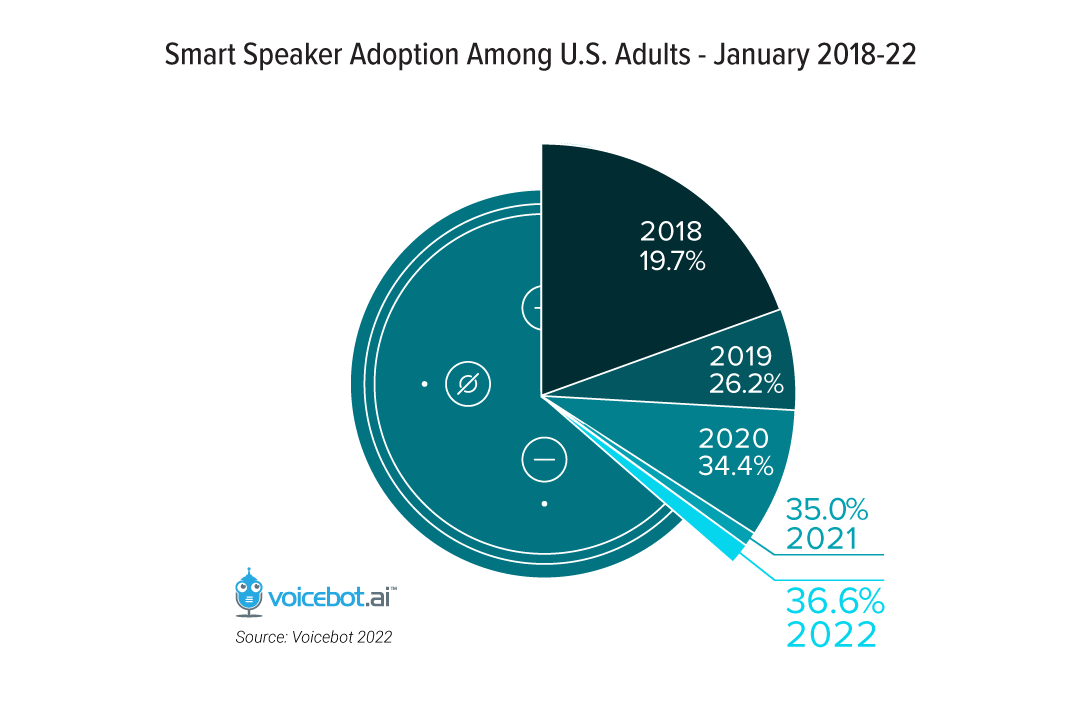
Still, the U.S. provides insights into how other markets will develop as most of the new features and voice apps come to the U.S. first. The question today is whether the 2.2% population adoption rise over the past two years can kick up again to something closer to the low double digits. If not, it may take three more years to achieve even 40% market penetration and there is no obvious path to 50% adoption.
Servicing the Existing Base
The response to these developments from the tech giants that provide the leading smart speaker brands suggests they are forecasting slow growth. Marketing campaigns focused on driving up awareness and new user adoption are less common. Programs to drive more developer engagement are fewer. There appears to be a focus that began in late 2019 to extract more frequent usage out of existing device owners for the features that already exist as opposed to the previous emphasis on new users and new applications.
Third-party developers are the biggest casualty of these changes. The report details the trends associated with independent Alexa Skill and Google Action use along with consumer sentiment. You can find out more about these developments in the full report and the free-to-download executive summary which includes additional charts and analysis.
Data in the Smart Speaker Report
The Smart Speaker Consumer Adoption Report 2022 is the most comprehensive analysis of the use, interest, sentiment, and market share related to smart speakers published to date. Some of the over 40 charts in the report are listed below. Click the button to see the full chart list and get the report.
- Smart Speaker Adoption Among U.S. Adults – 2018-22
- Smart Speaker Installed Base 2022
- U.S. Smart Speaker Market Share by Brand 2018-22
- U.S. Smart Speaker Market Share by Device 2022
- U.S. Smart Display Installed Base 2022
- Smart Speakers per Household Breakdown 2018-22
- Where Consumers Have Smart Speakers 2022
- Impact of COVID Pandemic on Smart Speaker Usage
- Smart Speaker Frequency of Use 2018-22
- Smart Speaker Use Case Frequency January 2022
- Question Category Frequency on Smart Speakers January 2022
- How Smart Speaker Owners Discover Voice Apps 2018-22
- Third-Party Voice App Users January 2022
- Monthly Third-Party Voice App Users 2019-22
- Third-Party Voice Games Use by Smart Speaker Use Frequency
- Qualities Users Value in Smart Speakers 2019-22
- Concern About Smart Speakers and Privacy Risk All U.S. Adults 2019-22
- Expected vs Actual U.S. Smart Speaker Ownership
- Reasons Consumers Give for Not Owning a Smart Speaker
- And 20+ more…
Use the button above to access the report. Also, if you have any questions or want to share your thoughts on the findings feel free to message Bret Kinsella on Twitter.
Follow @bretkinsella Follow @voicebotai