Over Half of U.S. Adults Have Smart Home Devices, Nearly 30% Use Voice Assistants with Them – NEW REPORT
The 2022 U.S. Smart Home Consumer Adoption Report revealed today that over half of U.S. adults have a smart home device that is not a smart speaker. These consumers own smart TVs, smart media or gaming consoles, smart lights, locks, cameras, or video doorbells, smart appliances or vacuum cleaners, and other devices. In the period 2017-19, smart speaker sales often helped drive smart home device adoption growth. Over the past two years, the growth catalyst has been the pandemic and the unique situations created by the government’s response to the healthcare crisis.
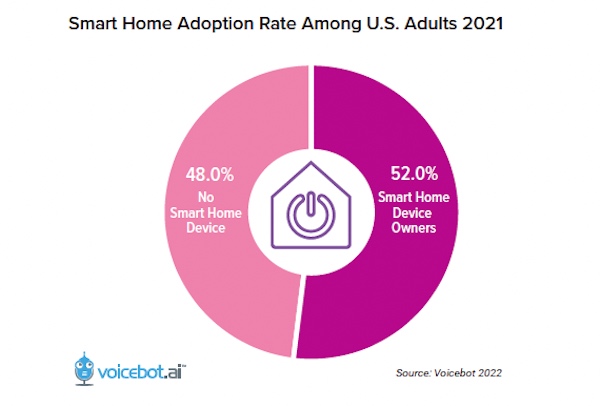
This figure rose from a user base of 48.5% of the population measured at the end of 2020. The change in user base combined with population growth drove a 2020 end-of-year rise in total users of 9% from about 124 million to nearly 135 million U.S. adults.
The smart home product category represents a large market that is also very diverse. Smart TV consumer adoption dynamics are very different from video doorbells, smart lighting, and temperature control. The new report tackles the overall market trends and activity along with insights for each major smart home device product category. Smart TVs are the largest segment but several other categories are growing faster.
Overlap Between Smart Home and Smart Speakers
The Smart Home Consumer Adoption Report also tackles the overlap between smart home devices and smart speakers and more broadly with voice assistant use. We recognize that some analysts consider smart speakers as included in the smart home category. For now, Voicebot Research considers them separate but complementary devices. The complementary assessment arises from the high overlap between owners of the different device categories and the fact that they are often used in concert.
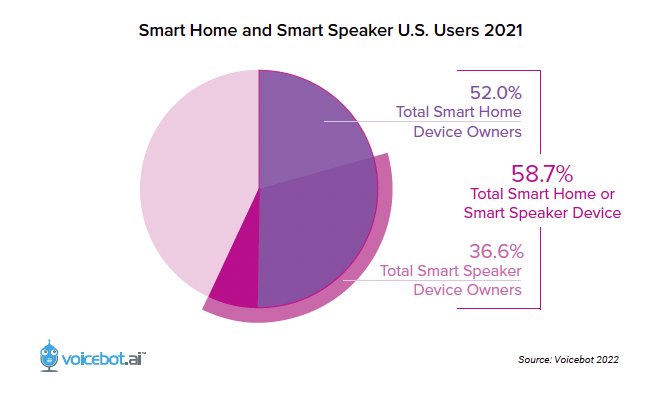
About 80% of smart speaker owners also have at least one smart home device. There are some smart speaker owners without smart home devices but it is a small number and likely to decline further. About 55% of smart home device owners have a smart speaker. Of course, there are more ways to use voice assistants with smart home devices than through smart speakers. The full report breaks down total voice assistant and voice command use with smart home devices as well as where different user interface modalities fall in terms of most frequently used.
Data in the Smart Home Report
The Smart Home Consumer Adoption Report 2022 is the most comprehensive analysis of the use, interest, sentiment, and behaviors related to smart home devices published to date. Some of the 29 charts in the report are listed below. Click the button to see the full chart list and get the report.
- Smart Home and Smart Speaker U.S. Users 2021
- Most Common Method for Controlling Smart Home Devices 2021
- Voice Assistant Use Through Personal Devices Among U.S. Adults – 2021
- Voice Assistant Adoption for Television Control and Search 2021
- Smart Home Device Frequency of Use 2021
- Smart Home Device Frequency of Use by Product 2021
- Smart Home and Other Device Users 2020-21
- Smart Home Adoption Rate of Smart Speaker Owners 2021
- Smart Home Adoption by Gender 2021
- Smart Home Adoption by Household Income 2021
- COVID-19 Impact on Smart Home Device Use in U.S. 2020-21
- And many more…
Use the button above to access the report. Also, if you have any questions or want to share your thoughts on the findings feel free to message Bret Kinsella on Twitter.
Follow @bretkinsella Follow @voicebotai
The Rise and Stall of the U.S. Smart Speaker Market – New Report
Voice Assistant Adoption Clustering Around 50% of the Population