
Smart Home Ownership Nearing 50% of U.S. Adults with Voice Assistant Control Becoming More Popular – New Research
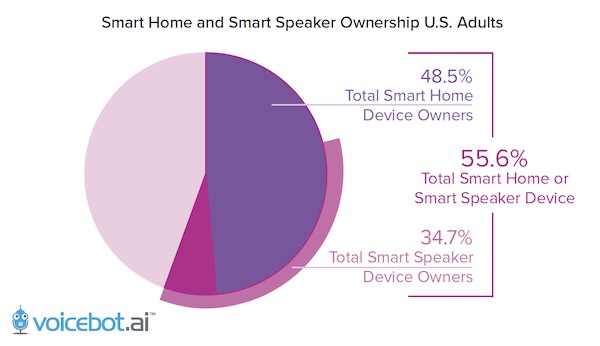
Voicebot today published our first in-depth analysis of the smart home market based on consumer behaviors. The Smart Home Consumer Adoption Report 2020, breaks down overall use by 10 different product categories not including smart speakers. In October 2020, 48.5% of U.S. adults reported having at least one smart home device that was not a smart speaker. This compares to a smart speaker adoption rate of 34.7%. More than 55% of U.S. adults have either a smart home device or a smart speaker.
Get the Report
From a smart home perspective, this translates into over 120 million consumers. There was a time not long ago when analysts questioned why adoption in the category was so slow. Even without considering smart speakers, the smart home product user base doubled over a two year period. While early adopters of smart home products tended to favor smart thermostats and smart TVs, a new surge in smart home adoption is being led by security products and smart appliances.
Voice Assistants and the Smart Home
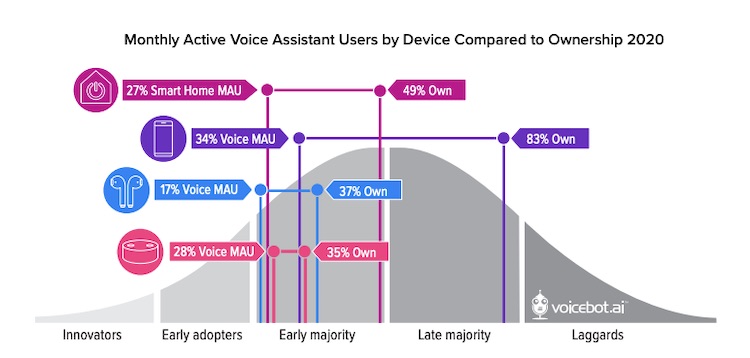
The adoption rate of smart home products is well ahead of smart speakers in terms of the total U.S. user base. However, it is interesting that monthly active users of voice assistants with the two device segments are nearly identical. About 27% of U.S. adults use voice assistants or voice interfaces to interact with their smart home devices on at least a monthly basis. Monthly active users (MAU) of voice assistants through smart speakers is 28%.
In the report, we discuss the complementary nature of smart home and smart speaker products. Smart home consumers were a critical segment in helping smart speakers gain initial market traction. That relationship flipped as smart speakers surged in popularity and became a new catalyst for smart home device adoption due to the ease of adding voice control for smart home products when using smart speakers. Some analysts consider smart speakers as a subset of the smart home market. Voicebot distinguishes between the two segments given key differences in the scope of capabilities and adoption rationale. This segmentation offers a finer view into smart home product category adoption without the data noise introduced by smart speakers.
The Smart Home Report for 2020
Voicebot’s Smart Home Consumer Adoption Report for 2020 offers new insights into the past and current usage patterns of smart home devices. Most of the data presented were gathered during a national consumer survey of about 1,100 U.S. adults in October 2020. This was supplemented with data from a June 2020 survey and earlier surveys in 2019 and 2018. This wealth of data enabled us to look at more than a simple snapshot of smart home adoption to get a view of how this market has changed recently. One example is the sharp rise in smart appliance adoption in Q3 2020 that broke from patterns in previous years.
Download ReportIn addition, we looked at how smart home users were employing voice assistants either with smart speakers, through other devices, or embedded within the devices. This analysis offers additional insight into how the different product categories have complementary adoption and use patterns with voice assistants. There are more than two dozen charts interspersed among 20 pages of analysis. Some of the charts include:
- Smart Home and Smart Speaker Ownership – U.S. Adults 2020
- Monthly Active Voice Assistant Users by Device Compared to Ownership
- Smart Home Adoption Rate Among U.S. Adults – 2020
- Smart Home and Other Device Users Among U.S. Adults – 2020
- U.S. Smart Home Adoption Rate by Product Category – 2020
- U.S. Smart Home Adult User Base by Product Category – 2020
- Smart Home Device Frequency of Use – 2020
- Smart Home Frequency of Use by Product Category – 2020
- Most Common Method for Controlling Smart Home Devices – 2020
- Most Common Method for Controlling Smart Home Devices by Product Category – 2020
- Length of Smart Home Device Ownership
- Length of Smart Home Device Ownership by Product Category
- Smart Home Adoption by Gender
- Smart Home Adoption Rate for Smart Speaker Owners
- Voice Assistant Use with Smart Home Devices
- Voice Assistant Usage Rate by Device
- Voice Assistant Adoption Through Smart Home Devices by Product Category
- Voice Assistant Adoption Through Smart Home Devices by Age Cohort
- And many more…
To learn more about the report and Voicebot Research goto research.voicebot.ai.
Follow @bretkinsella Follow @voicebotai
Baidu Upgrades DuerOS Voice Platform and Hits 400M Device Milestone
Baidu Upgrades DuerOS Voice Platform and Hits 400M Device Milestone
Nearly 90 Million U.S. Adults Have Smart Speakers, Adoption Now Exceeds One-Third of Consumers