Voice Assistant Use on Smartphones Rise, Siri Maintains Top Spot for Total Users in the U.S.
- New report available today shows that voice assistant users on smartphones rose 11% between 2018-2020 and daily active users climbed 23%.
- Smartphone voice assistant use grew at a faster rate than overall smartphone ownership
- Apple Siri continues to maintain a market share lead among voice assistants used on smartphones in the U.S.
- The report includes the first significant analysis of custom voice assistants deployed within mobile apps
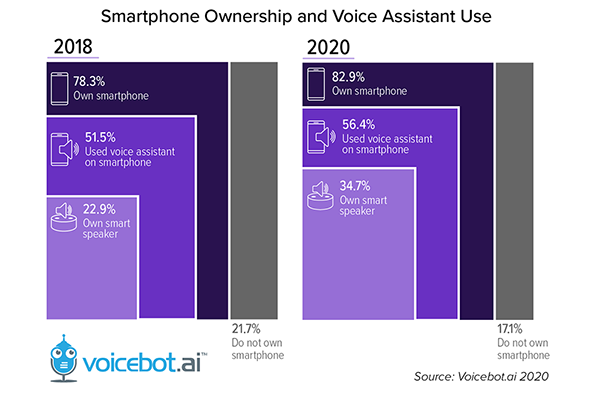
Voicebot today published our second bi-annual report on voice assistant adoption on smartphones among U.S. adults. The report includes more than 40 charts and graphs along with nearly 50 pages of analysis. The Smartphone Voice Assistant Consumer Adoption Report is based on data from a national survey conducted in October 2020. Results show that voice assistant use on smartphones rose from 51.5% in the fall of 2018 to 56.4% today.
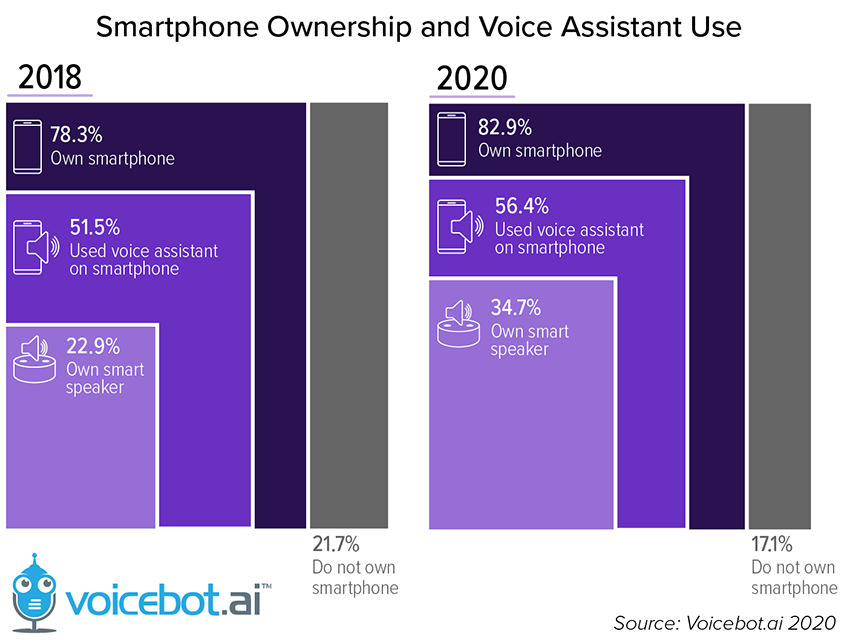
That might seem like a modest rise. However, the population and smartphone ownership both expanded while frequency of use climbed. That lead to an 11% rise in total users and a 23% increase in daily active users of voice assistants on their smartphones.
Get ReportVoice Assistant User Base Market Share on Smartphones
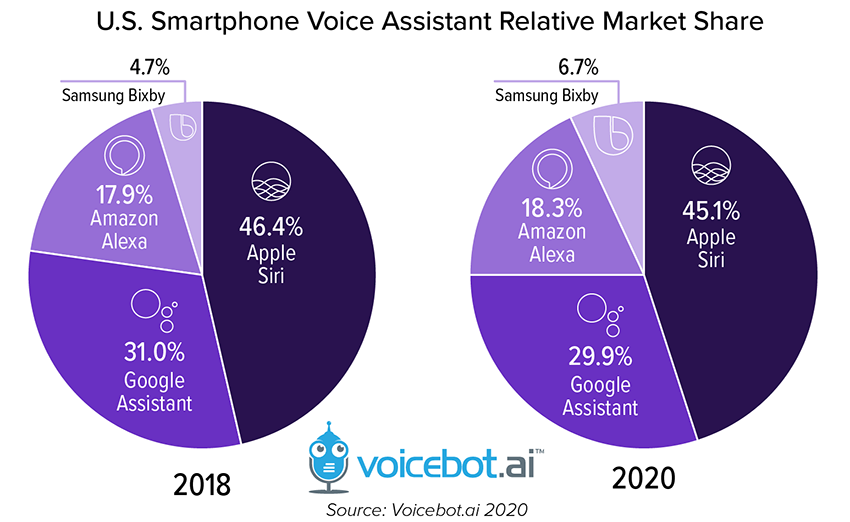
Similar to 2018, Apple’s Siri continues to claim the largest relative market share among smartphone voice assistants. Its share is down slightly from 2018 but still came in at 45.1% compared to 29.9% for Google Assistant, 18.3% for Amazon Alexa, and 4.7% for Samsung Bixby.
In addition to detailed data from both 2018 and 2020, the report also looks at not just today users, but also monthly active users, the share of total interactions, the usage rate of the popular general purpose assistants, and more. There are also data broken down by assistant based on gender, age, and income.
More about Smartphone Voice Assistant Consumer Adoption
There is a great deal of data specific to Amazon Alexa, Apple Sir, Google Assistant, and Samsung Bixby in the report. However, there is far more data presented about consumer use case frequency, sentiment, and attitudes. And, the report includes the first data we know of that breaks down details related to custom voice assistants embedded in mobile apps. Voicebot Research members have access immediately to the report as well as a gallery of all of the charts in PDF format. There is also an executive summary that anyone can download at research.voicebot.ai.
Download NowThe data is accompanied by an in-depth analysis of key trends driving voice assistant adoption on smartphones, how that shapes our current view of the market, and where it is headed. Specific areas address are the popular consumer voice assistants, in-app custom assistants, smartphone hardware platforms, and smartphone peripheral devices such as hearables, smart watches, and smart glasses. A list of charts includes:
- Smartphone Ownership and Voice Assistant Use – comparing ownership and use rates in 2018 and 2020
- Smartphone Voice Assistant User Base – broken out by casual, monthly active, and daily active users 2018-20
- U.S. Smartphone Voice Assistant Relative Market Share – 2018-20
- U.S. Smartphone Voice Assistant Share of Interactions – 2018-20
- Smartphone Voice Assistant Adoption by Gender – overall adoption, plus voice assistant use by gender
- Smartphone Voice Assistant Users by Income – broken out by voice assistant
- Smartphone Voice Assistant Adoption by Age Cohort – for all voice assistants
- Smartphone Voice Assistant Users by Age Cohort – segmented by voice assistant
- U.S. Smartphone Voice Assistant User Frequency – 2018-20
- U.S. Smartphone Voice Assistant Use Per Day Per User – 2018-20
- Voice Assistant Monthly Active User Rate Among all Smartphone Owners
- Most Frequent Method for Accessing Smartphone Voice Assistants – mic from smartphone, car, earbuds
- Where Consumers Use Smartphone Voice Assistants by Frequency – both home and on the go contexts
- Frequency of Use for Nine Common Information and Entertainment Use Cases – segmented into tried, MAU, DAU
- Frequency of Use for Eight Common Productivity Use Cases – segmented into tried, MAU, DAU
- Ranking for Top 10 Most Popular Voice Assistant Use Cases Among U.S. Smartphone Owners
- What Consumers Say Would Cause Them to Use Smartphone Voice Assistants More – 2018-20
- Level of Consumer Privacy Concern Related to Smartphone-based Voice Assistants
- Ratio of Voice Assistant Adoption on iOS and Android Smartphones – 2018-20
- Usage Rate of Voice Assistants on iPhone – 2018-20
- Usage Rate of Voice Assistants on Android Smartphones – 2018-20
- Usage Rate of Voice Assistants on Samsung Smartphones – 2018-20
- Usage Rate of Amazon Alexa Across Smartphones – 2018-20
- Interest of U.S. Adults in Using Voice Assistants within Mobile Apps
- Use of Voice Assistants by U.S. Adults in Mobile Apps
- Smartphone App Voice Assistant Feature Interest by Consumers
- Smartphone App Voice Assistant Feature Use Experience by Consumers
- And many more….
To learn more about the report, Voicebot Research, and to download earlier reports, go to reserach.voicebot.ai.
Get Report
Follow @bretkinsella Follow @voicebotai
National Consumer Survey Reveals that a lot of Consumers Want Voice Assistants in Mobile Apps
Nearly 90 Million U.S. Adults Have Smart Speakers, Adoption Now Exceeds One-Third of Consumers